Most Flutter apps crash silently in production.
When a Flutter app crashes on a user’s device, developers often don’t know what broke, why it broke, or how many users were affected.
This is where Flutter crash reporting becomes important.
In real-world production environments, crashes happen due to unexpected user behavior, device-specific issues, OS updates, or network failures.
Depending upon basic logs is not enough. Logs don’t capture real user crashes, stack traces, or device details in real time.
As a result, teams struggle to fix issues quickly, leading to poor user experience. Crashes directly impact:
- User retention and daily active users.
- App store ratings and reviews.
- Business revenue and brand trust.
This is why modern teams use real-time crash reporting for Flutter apps.
Here in this blog, you can learn about Real-time crash reporting in Flutter and complete code to build Flutter crash reporting dashboard.
What Is a Real-Time Crash Reporting Dashboard in Flutter?
A real-time crash reporting dashboard in Flutter is a centralized panel that shows live crash data from your Flutter app.
Instead of digging through raw logs, you get clear insights into what’s breaking in your app. Crash analytics Flutter dashboards provide:
- Real-time crash updates.
- Grouped errors by type and severity.
- Full stack traces with device and OS details.
- Affected user count per crash.
A Flutter crash reporting dashboard visually displays:
- Recent crashes and trends.
- Most frequent errors.
- Crashes by app version and platform.
- High-impact issues needing urgent fixes.
With real-time error reporting, developers can debug faster, reduce downtime, and ship stable updates quickly.
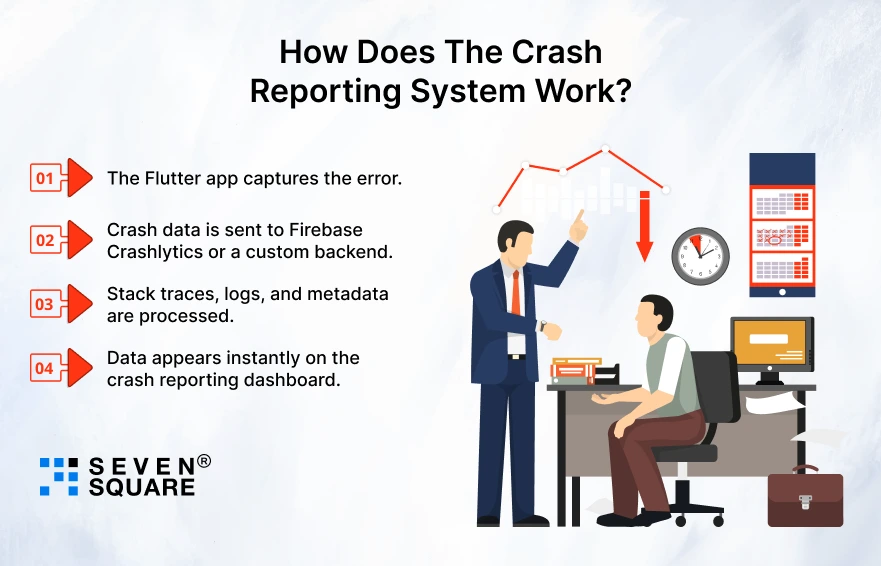
How Does The Crash Reporting System Work?

A typical real-time crash reporting Flutter system follows a simple but powerful flow:
Flutter App → Crash Event → Backend → Live Dashboard
When a crash occurs:
- The Flutter app captures the error.
- Crash data is sent to Firebase Crashlytics or a custom backend.
- Stack traces, logs, and metadata are processed.
- Data appears instantly on the crash reporting dashboard.
You can choose between:
- Firebase Crashlytics for quick setup and reliability.
- Custom backend for more control and advanced analytics.
To make Flutter error tracking production-ready, the system must handle high traffic, secure sensitive data, and scale smoothly as your app grows.
Which Tools & Tech Stack Are Used in This Crash Reporting Dashboard?
This crash reporting solution uses a modern and scalable tech stack designed for performance and reliability.
- Flutter to capture crash events and exceptions.
- Firebase Crashlytics Flutter for real-time crash logging.
- Backend layer (optional) using Firebase, Node.js, or APIs.
- Dashboard UI built using Flutter Web or an admin panel.
- GitHub repository with a clean folder structure and reusable code.
This setup makes the crash reporting Flutter app easy to maintain, extend, and integrate into existing Flutter projects.
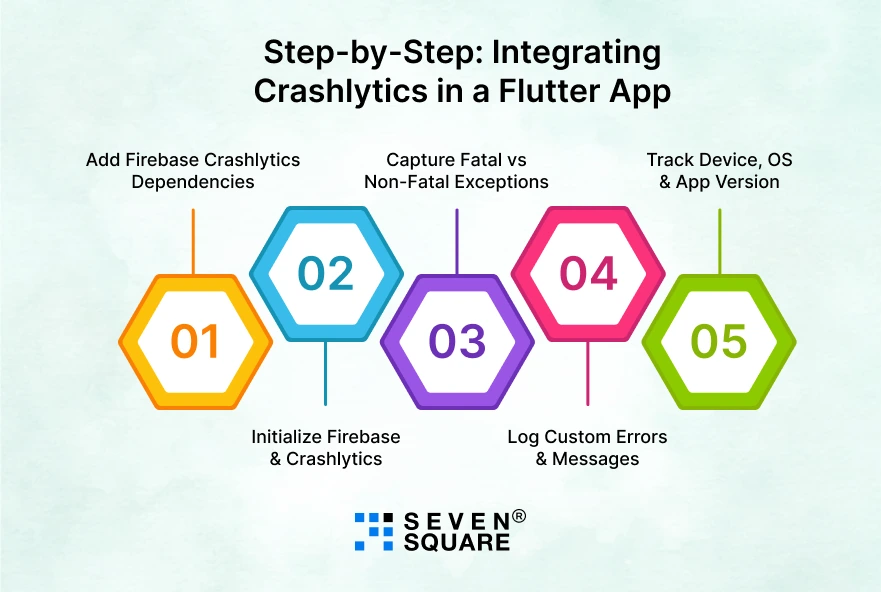
Step-by-Step: Integrating Crashlytics in a Flutter App

Learn how to integrate Crashlytics in Flutter properly so your app can report crashes, exceptions, and custom errors in real time.
Step 1: Add Firebase Crashlytics Dependencies
Add these packages to your pubspec.yaml:
                dependencies:
                flutter:
                    sdk: flutter
                firebase_core: ^2.27.0
                firebase_crashlytics: ^3.5.0
Run:
flutter pub get
Step 2: Initialize Firebase & Crashlytics
In main.dart:
                import 'package:flutter/material.dart';
                import 'package:firebase_core/firebase_core.dart';
                import 'package:firebase_crashlytics/firebase_crashlytics.dart';

                void main() async {
                WidgetsFlutterBinding.ensureInitialized();
                await Firebase.initializeApp();

                FlutterError.onError = FirebaseCrashlytics.instance.recordFlutterFatalError;

                runApp(const MyApp());
                }
This ensures Flutter exception reporting works even for framework-level crashes.
Step 3: Capture Fatal vs Non-Fatal Exceptions
Non-Fatal Exception (Handled error)
               try {
                    throw Exception("Non-fatal test exception");
                    } catch (e, stack) {
                    FirebaseCrashlytics.instance.recordError(
                        e,
                        stack,
                        reason: 'Handled non-fatal exception',
                    );
                }
Fatal Exception (App crash)
FirebaseCrashlytics.instance.crash();
This clear separation helps your Flutter crash reporting dashboard prioritize serious issues.
Step 4: Log Custom Errors & Messages
                FirebaseCrashlytics.instance.log("User clicked checkout button");
                FirebaseCrashlytics.instance.setCustomKey("user_type", "premium");
                FirebaseCrashlytics.instance.setCustomKey("screen", "HomePage");
These logs make crash debugging much faster.
Step 5: Track Device, OS & App Version
                FirebaseCrashlytics.instance.setCustomKey("os", "Android");
                FirebaseCrashlytics.instance.setCustomKey("app_version", "1.0.4");
                FirebaseCrashlytics.instance.setCustomKey("device_model", "Pixel 7");
This data is important for app stability monitoring of Flutter apps in production.
How to Build the Real-Time Crash Reporting Dashboard UI?
This is where your blog becomes unique. Instead of just showing Crashlytics screenshots, you build a dashboard for app crashes in Flutter.
Dashboard Data Model
                class CrashReport {
                final String error;
                final String stackTrace;
                final int affectedUsers;
                final String severity;

                CrashReport({
                    required this.error,
                    required this.stackTrace,
                    required this.affectedUsers,
                    required this.severity,
                });
                }
Sample Dashboard UI (Flutter Web / Admin Panel)
                import 'package:flutter/material.dart';

                class CrashDashboard extends StatelessWidget {
                final List <CrashReport> reports;

                const CrashDashboard({super.key, required this.reports});

                @override
                Widget build(BuildContext context) {
                    return Scaffold(
                    appBar: AppBar(title: const Text("Crash Analytics Dashboard")),
                    body: ListView.builder(
                        itemCount: reports.length,
                        itemBuilder: (context, index) {
                        final report = reports[index];
                        return Card(
                            child: ListTile(
                            title: Text(report.error),
                            subtitle: Text(
                                "Users: ${report.affectedUsers} | Severity: ${report.severity}",
                            ),
                            ),
                        );
                        },
                    ),
                    );
                }
                }
What Does This Dashboard Show?
- Crash frequency per error.
- Number of affected users.
- Error severity (low / medium / critical).
- Grouped crashes by stack trace.
This makes your crash analytics dashboard far more actionable than raw logs.
How to Make Crash Reporting Truly Real-Time?
Real-time crash reporting means your dashboard updates the moment a crash happens.
How Real-Time Crash Monitoring Works?
- Flutter app logs a crash.
- Backend stores crash data (Firestore / API).
- Dashboard listens for changes.
- UI updates instantly.
This is the backbone of real-time error reporting in Flutter apps.
Using Firestore Streams for Live Updates
                import 'package:cloud_firestore/cloud_firestore.dart';

                Stream <List<CrashReport>> crashStream() {
                return FirebaseFirestore.instance
                    .collection('crashes')
                    .snapshots()
                    .map((snapshot) {
                    return snapshot.docs.map((doc) {
                    final data = doc.data();
                    return CrashReport(
                        error: data['error'],
                        stackTrace: data['stack'],
                        affectedUsers: data['users'],
                        severity: data['severity'],
                    );
                    }).toList();
                });
                }
Connect Stream to Dashboard UI
                StreamBuilder<List<CrashReport>>(
                stream: crashStream(),
                builder: (context, snapshot) {
                    if (!snapshot.hasData) {
                    return const Center(child: CircularProgressIndicator());
                    }
                    return CrashDashboard(reports: snapshot.data!);
                },
                );
Now your Flutter crash monitoring tools show live crashes without refresh.
Here’s the Complete GitHub Code to Create a Real-Time Crash Reporting Dashboard in Flutter.
What’s Our Expertise in Flutter Crash Analytics & Monitoring?
- We create real-time crash reporting Flutter apps that instantly detect, analyze, and prioritize critical production crashes.
- Our crash analytics dashboards help developers track affected users, crash frequency, and error severity efficiently.
- Our experienced team delivers Flutter error tracking solutions that scale smoothly for startups, enterprises, and growing businesses.
- We design custom crash monitoring tools tailored to your app architecture, traffic volume, and business goals.
- Our solutions improve app stability monitoring in Flutter without impacting performance or user experience.
Want a Customized Flutter App with a Crash Analytics Dashboard? Contact Us Today!
Firebase Crashlytics vs Custom Crash Reporting: What Should You Choose?
Choosing between Firebase Crashlytics and a custom crash reporting system depends on your app’s needs.
| Feature | Firebase Crashlytics | Custom Crash Reporting System |
| Setup Time | Very fast setup with minimal configuration in Flutter apps. | Requires backend, APIs, database, and dashboard development. |
| Ease of Integration | Easy to integrate Crashlytics in Flutter using the official Firebase SDK. | Needs custom Flutter exception reporting and API handling. |
| Real-Time Crash Reporting | Near real-time crash reporting with built-in alerts. | Fully real-time crash reporting for Flutter apps using streams or WebSockets. |
| Dashboard Customization | Limited customization in the Crashlytics dashboard. | Fully customizable crash reporting dashboard in Flutter. |
| Crash Analytics Depth | Basic crash analytics Flutter developers need. | Advanced crash analytics with custom filters and insights. |
| Stack Trace Grouping | Automatic grouping by Firebase. | Full control over grouping by error type and stack trace. |
| Affected Users Tracking | Shows the affected user count. | Can track users, sessions, regions, and devices. |
| Device & OS Metadata | Automatically collected. | Custom metadata tracking (device, OS, app version, user type). |
| Performance Impact | Optimized with minimal app performance impact. | Depends on how efficiently crash reporting is implemented. |
| Data Ownership | Crash data is stored on Firebase servers. | Full ownership and control over crash data. |
| Security & Compliance | Google-managed security and compliance. | Custom security, encryption, and compliance controls. |
| Cost | Free for most Flutter apps. | Higher cost due to backend, hosting, and maintenance. |
Building Stable Flutter Apps with Smart Crash Reporting
Every serious Flutter app needs crash analytics to succeed in production.
Without proper monitoring, crashes silently hurt user trust and business growth. A real-time crash reporting dashboard helps teams:
- Detects issues instantly.
- Improve app stability.
- Deliver better user experiences.
As your app grows, you can scale your mobile app crash analytics by adding alerts, deeper insights, & custom reporting to turn crash data into a competitive advantage.
FAQs
- You can use Firebase Crashlytics or a custom backend to capture crashes and display them on a real-time dashboard.
- Yes, but large apps often combine Crashlytics with custom analytics for deeper insights and better control.
- Yes, Flutter Web or admin dashboards can be used to build a fully custom crash reporting dashboard.
- No, when implemented correctly, Flutter crash reporting has minimal impact on app performance.