A live stock price dashboard in ReactJS pairs React with WebSockets, so prices update the instant they change instead of on a delay. This keeps the app fast and smooth even with thousands of updates streaming in. It’s the same setup real trading platforms rely on, not manual refreshes or delayed polling.
Do you know how many trades your platform loses to a two-second lag?
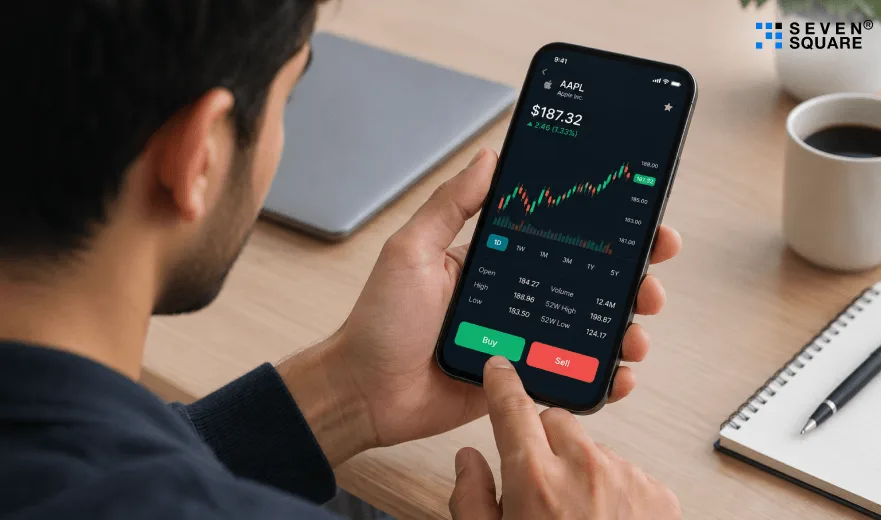
A user opens your trading app during market open.
Prices shift the moment the page loads.
By the time it refreshes, the number’s already wrong.
They tap buy anyway, trusting the screen.
The trade executes at a different price.
They notice. They screenshot it. They post about it.
Support gets the ticket an hour later.
Nobody flags it as a product issue.
But that one lagging screen just cost you a user who won’t come back.
Why React and WebSockets Power the Best Live Stock Price Dashboards
Why React’s component reactivity is ideal for stock markets?
- React’s state system updates only the components that change, not the entire UI.
- This is crucial when hundreds of stock prices are updating many times per second.
- This combination powers a smooth, stable, and fast real-time stock price ReactJS experience.
How Do WebSockets Keep Connections alive?
- REST APIs send data only when you request it.
- WebSockets keep a constant connection open, pushing new stock prices the moment they change.
- This makes them perfect for stock markets where every millisecond matters.
Comparison Between WebSocket vs REST polling vs SSE
| Method | Speed | Server Cost | Best For |
|---|---|---|---|
| WebSocket | Fastest | Low | Live prices, trading dashboards. |
| REST polling | Slow | High | Basic static dashboards. |
| SSE | Medium | Medium | Notifications, chat apps. |
For real-time finance, WebSockets win every time, which is why your React WebSocket stock dashboard will run millisecond-level updates.
How Data Flows Through a Live Stock Price Dashboard
Easy diagram of live data flow
WebSocket Server → Live Price Stream → React State → Real-Time Chart UI
Client-side structure
Your stock market dashboard React app will include:
- WebSocketService.js(Handles connection & messages)
- Ticker.js(Displays fast-moving stock prices)
- LiveChart.js(Renders the real-time price chart)
- Dashboard.js(Main layout)
- App.js(App container)
This modular design keeps everything clean and scalable.
WebSocket price stream
- Each new price received from the WebSocket instantly updates the UI.
- No refresh. No delay. No repeated API calls.
Chart rendering logic
- The real time stock price tracker uses a chart library like Recharts or Chart.js, where new points are added live.
- Old data scrolls smoothly as new prices arrive, just like a real trading platform.
Step 1: Setting Up Your Project for a Live Stock Price Dashboard
Before building a real-time dashboard, you must set up a clean, scalable React project.
A proper structure helps you handle fast WebSocket stock price updates without slowing down your app.
Clean Project Architecture
For a trading dashboard, your structure should separate UI components, WebSocket services, and utility logic.
This keeps your code clean and prevents slowdowns during live updates.
Folder Structure
/src
┣ /components
┃ ┣ LiveTicker.js
┃ ┣ LiveChart.js
┃ ┗ MarketStatus.js
┣ /services
┃ ┗ WebSocketService.js
┣ /hooks
┃ ┗ useWebSocket.js
┣ /utils
┃ ┗ formatNumber.js
┣ App.js
┗ index.js
This structure keeps your real time stock updates ReactJS app organized and scalable.
Installing Dependencies
Run this to install React + WebSocket + chart library:
npm install recharts
If you prefer Chart.js:
npm install chart.js react-chartjs-2
You don’t need extra packages for WebSockets; the browser supports it natively.
Step 2: Connecting Your Live Stock Price Dashboard to Real-Time Data
To receive WebSocket stock price updates, you need to connect to a real-time streaming API. Below is simple, reusable WebSocket connection code.
WebSocketService.js
                // /src/services/WebSocketService.js
                export const connectWebSocket = (onMessage, onStatusChange) => {
                const socket = new WebSocket("wss://your-stock-websocket-url");

                socket.onopen = () => {
                    console.log("WebSocket Connected");
                    onStatusChange("connected");
                };

                socket.onmessage = (event) => {
                    const data = JSON.parse(event.data);
                    onMessage(data);
                };

                socket.onclose = () => {
                    console.log("WebSocket Closed. Reconnecting...");
                    onStatusChange("reconnecting");

                    setTimeout(() => {
                    connectWebSocket(onMessage, onStatusChange);
                    }, 1000);
                };

                socket.onerror = () => socket.close();

                return socket;
                };
How Does the connection work?
- Onopen: Connection successful.
- Onmessage: You receive new stock prices.
- Onclose: Auto-reconnect logic.
- Onerror: Prevent crashes.
This ensures your dashboard never goes offline, even if the server disconnects.
Step 3: Displaying Prices in Your Live Stock Price Dashboard
React must update live prices without re-rendering too often. Otherwise, your dashboard will lag.
| Goal | Solution |
|---|---|
| Avoid lag | useRef for fast updates |
| Reduce re-renders | Throttling |
| Update at millisecond speed | Mutable refs + lightweight state |
Live Price Hook (Highly Optimized)
                // /src/hooks/useLivePrice.js
                    import { useEffect, useRef, useState } from "react";

                    export const useLivePrice = () => {
                    const [price, setPrice] = useState(0);
                    const lastUpdate = useRef(Date.now());

                    const updatePrice = (newPrice) => {
                        const now = Date.now();

                        // Throttle updates to avoid overload
                        if (now - lastUpdate.current > 10) {
                        setPrice(newPrice);
                        lastUpdate.current = now;
                        }
                    };

                    return { price, updatePrice };
                    };
This allows millisecond-level updates without freezing the UI.
Step 4: Adding Charts to Your Live Stock Price Dashboard
A live stock price chart React must update smoothly even when thousands of new points arrive. Below is a clean example using Recharts.
LiveChart.js
                // /src/components/LiveChart.js
                import { useEffect, useState } from "react";
                import { LineChart, Line, XAxis, YAxis, Tooltip } from "recharts";

                const LiveChart = ({ stream }) => {
                const [data, setData] = useState([]);

                useEffect(() => {
                    setData((prev) => [...prev.slice(-80), stream]); // Keep only last 80 points
                }, [stream]);

                return (
                    <LineChart width={600} height={300} data={data}>
                    <XAxis dataKey="time" hide />
                    <YAxis domain={["dataMin", "dataMax"]} />
                    <Tooltip />
                    <Line
                        type="monotone"
                        dataKey="price"
                        stroke="#4caf50"
                        dot={false}
                    />
                    </LineChart>
                );
                };

                export default LiveChart;
How does this work?
- New data is streamed into the chart
- Old data scrolls away (TradingView-style)
- Only 80 points are rendered → no lag
- Line chart updates instantly
Step 5: Building the Full Live Stock Price Dashboard UI
Now that everything is ready, let’s build the full UI. Your dashboard includes:
- Live ticker
- Real-time chart
- Stock metadata
- Market status indicators
- Error alerts (if WebSocket disconnects)
Dashboard.js
                // /src/components/Dashboard.js
                import { useState } from "react";
                import LiveChart from "./LiveChart";
                import { connectWebSocket } from "../services/WebSocketService";
                import { useLivePrice } from "../hooks/useLivePrice";

                const Dashboard = () => {
                const { price, updatePrice } = useLivePrice();
                const [status, setStatus] = useState("connecting");
                const [streamData, setStream] = useState({ time: 0, price: 0 });

                const socket = connectWebSocket((data) => {
                    updatePrice(data.price);

                    setStream({
                    time: new Date().toLocaleTimeString(),
                    price: data.price,
                    });
                }, setStatus);

                return (
                    <div style={{ padding: "20px" }}>
                    <h2>Real-Time Stock Dashboard (React + WebSocket)</h2>

                    <p>Status: <strong>{status}</strong></p>
                    <p>Live Price: <strong>${price}</strong></p>

                    <LiveChart stream={streamData} />
                    </div>
                );
                };

                export default Dashboard;
This creates a complete real-time stock dashboard UI with live charts and tickers.
Step 6: Optimizing Your Live Stock Price Dashboard for Speed
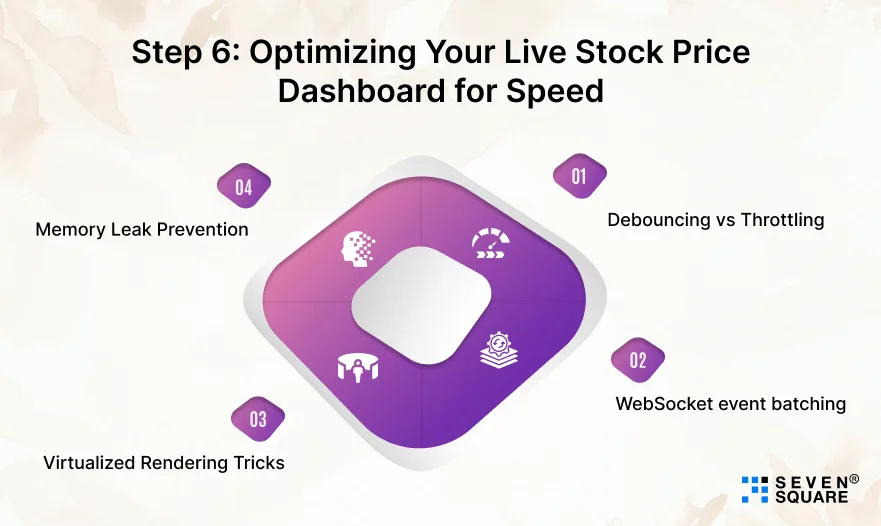
A real-time dashboard must stay fast even when receiving thousands of updates. Here are the important optimization techniques.
1. Debouncing vs Throttling
- Throttling: Update the UI at fixed intervals (best for charts).
- Debouncing: Wait until user interaction stops.
- For stock prices, always use throttling.
2. WebSocket event batching
Instead of updating the chart on every message, group messages together:
                let buffer = [];

                socket.onmessage = (event) => {
                buffer.push(JSON.parse(event.data));
                };

                setInterval(() => {
                if (buffer.length > 0) {
                    processBatch(buffer);
                    buffer = [];
                }
                }, 50);
This reduces chart redraws.
3. Virtualized Rendering Tricks
- Avoid rendering too many elements in the DOM.
- For long lists of stock data → use react-window or react-virtual.
4. Memory Leak Prevention
Always clean up WebSockets:
                useEffect(() => {
                return () => socket.close();
                }, []);
Without this, your app may crash on repeated navigation.
Here’s the Complete GitHub Code
How We Build Live Stock Price Dashboards That Perform
- Dashboards we’ve built stay stable even when thousands of price updates hit every second.
- The architecture is designed to handle that load without lag or dropped connections, because a dashboard that freezes during a market swing isn’t just a bug, it’s lost trust.
- Live charts that auto-scroll smoothly, tickers that never miss a beat, and market indicators updating in real time, these aren’t extras, they’re the baseline. Every piece is built to feel like a real trading platform, not a prototype pretending to be one.
- Staying close to how WebSockets and React evolve means what gets built for you today won’t feel outdated in a year. That’s what keeps your product competitive as user expectations rise.
Ready to build a Real-Time Stock dashboard that holds up under pressure?
FAQs
Timelines depend on complexity, but a focused MVP with core price streaming and charts can often launch in a few weeks. We prioritize getting a working version live before layering in advanced features.
Yes, you’ll need a WebSocket-based market data feed like Polygon.io or Finnhub. We help clients choose a provider based on latency, cost, and coverage before development starts.
It depends on how the streaming and rendering logic is built from day one. We architect this with scale in mind so a growing user base doesn’t mean rebuilding the dashboard later.
Yes, a well-built live stock price dashboard is modular enough to support this. We often start with core price streaming, then layer in alerts, filters, and multi-stock views as the product matures.
A properly built dashboard automatically reconnects without the user noticing a major disruption. We build this resilience in from the start, since dropped connections are common in real-world usage.